Screenshots
Both viewers read the same thing — the runs recorded under .testfile/
(see the CLI & TUI page) — and neither of them ever starts a
test. testfile serve opens the web viewer in a browser, testfile tui
the terminal one; which one is nicer depends on where you are, not on
what you can see.
Every picture below is a committed screenshot from the test suites: the browser ones are the Playwright shots the viewer’s suite compares against, the terminal ones are rendered from the exact frames the TUI’s own suite pins. Nothing here is a mockup, and neither UI can change without these changing with it.
Each suite has its own fixed little fixture, and both are recordings of
a ci suite: three runs, older passing ones and a newer failing one, a
cached test, a failing assertion, two services and a run carrying
platform variants — the web viewer’s fixture has that one as a run
merged from a Linux and a Windows leg.
The web viewer
testfile serve (see the web viewer).
Runs
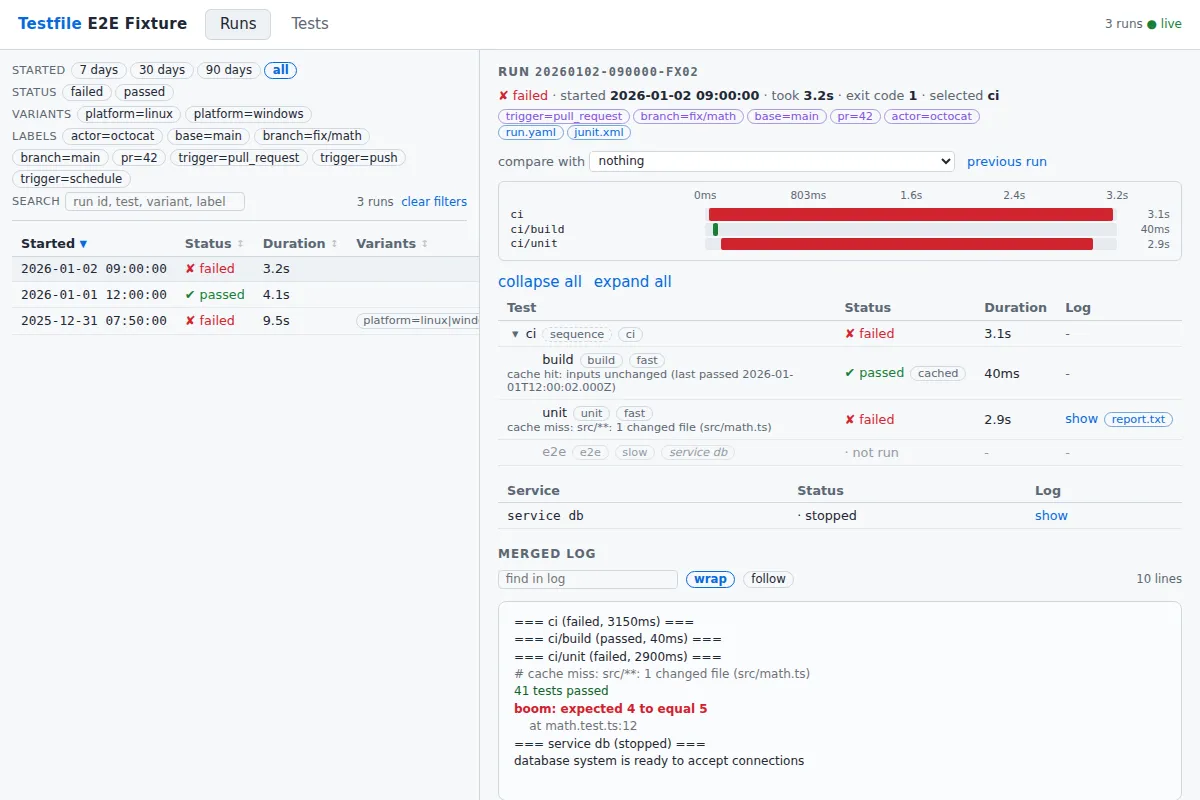
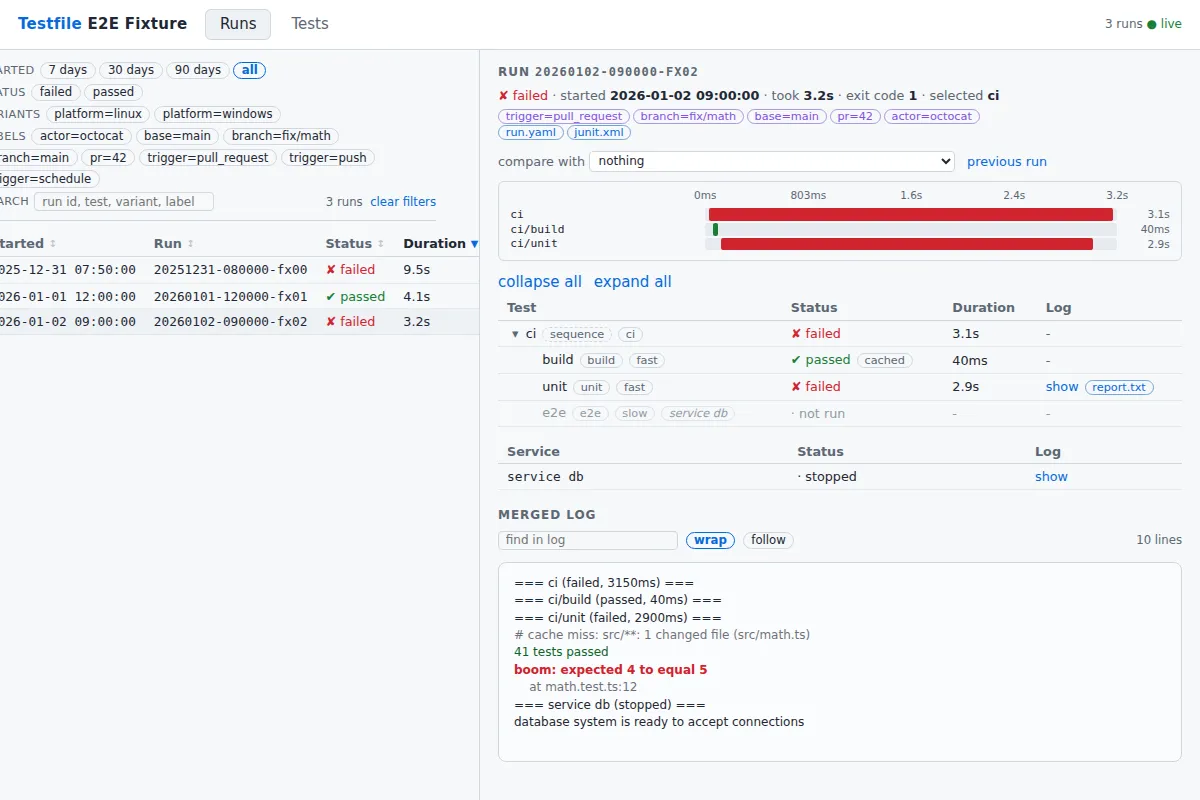
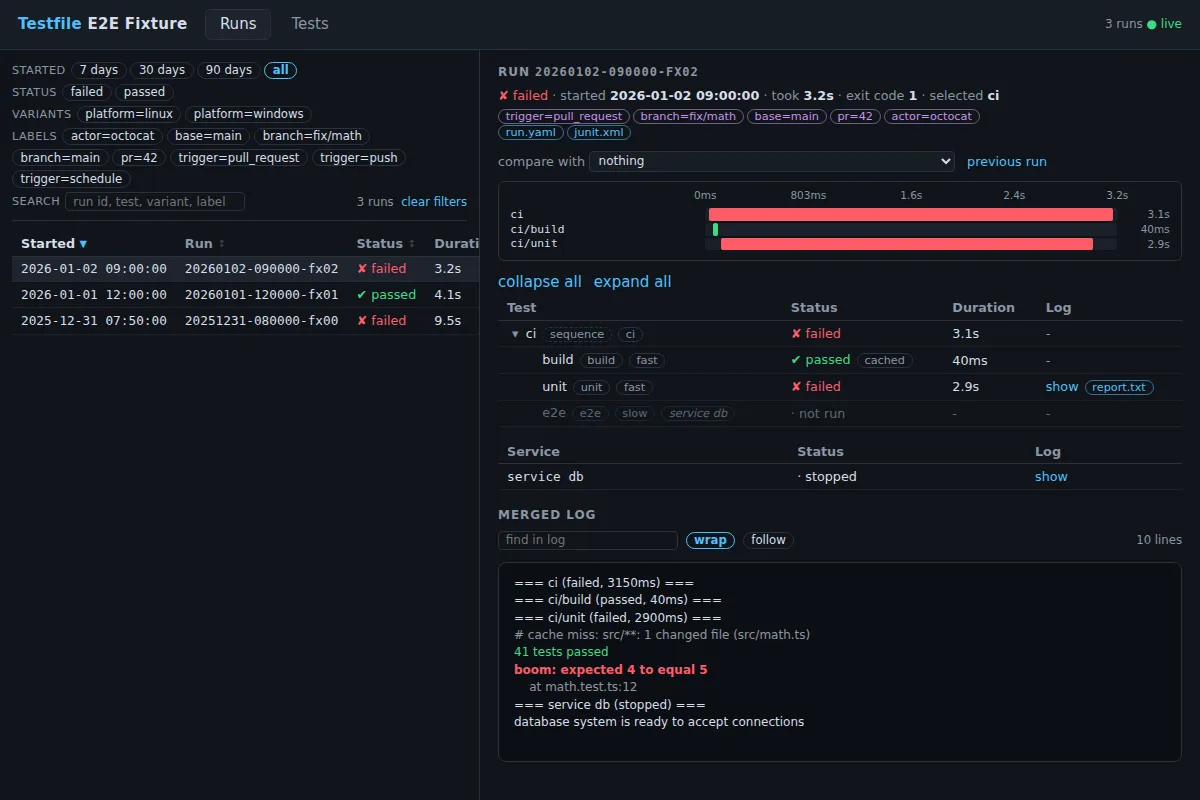
The history on the left, the selected run on the right — and that one page is most of the viewer:
- the run’s labels (who triggered it, from which branch, for which
pull request) and the files it kept: the record the page was built
from (
run.yaml) and the reports next to it (junit.xml), - a timeline of the run’s wall clock, one bar per test at its start offset, scaled to its duration and coloured by status; clicking a bar opens that test’s log,
- the suite tree with this run’s results on it — kinds, tags,
declared services, the cache marker, an
artifact linked from the row of the test
that produced it, and what did not run:
ci/e2eis in the Testfile but was never reached, and says so, - the services of the run in their own table, each with its log,
- and the merged log of everything, at the bottom.
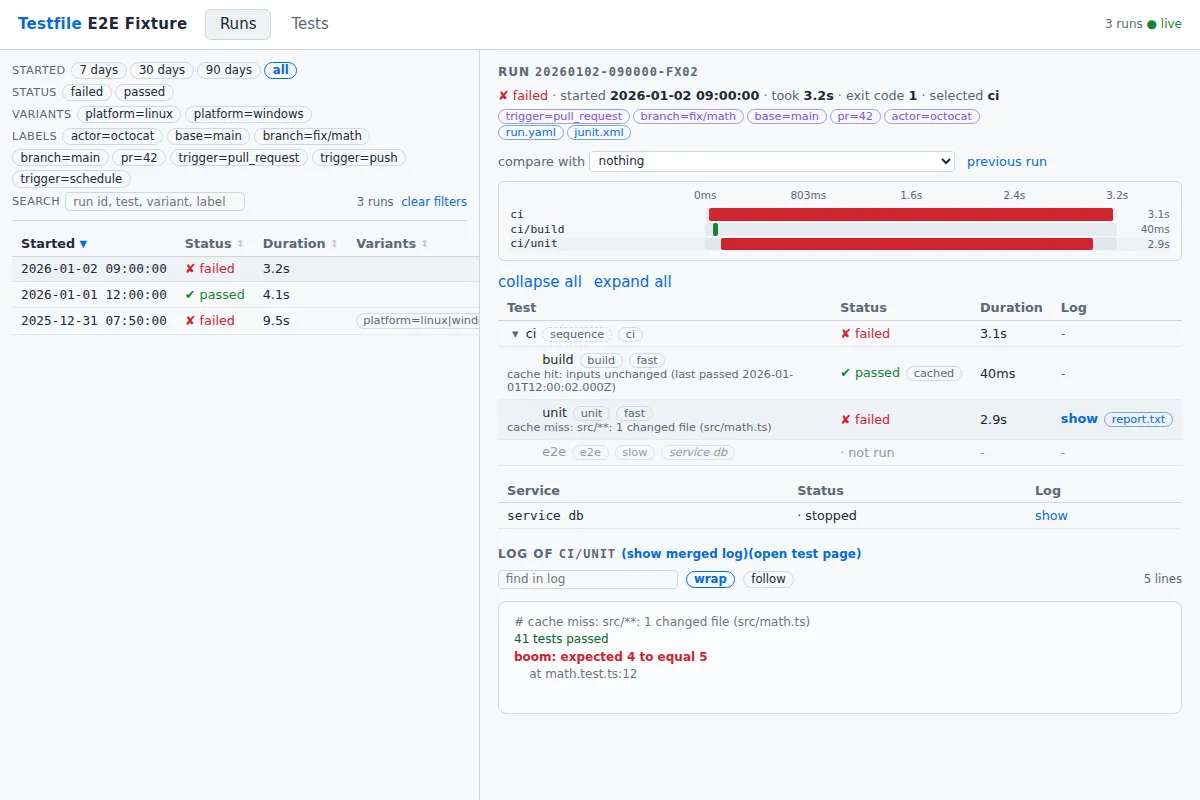
A single test’s log
Selecting a row in the tree — or a bar on the timeline — replaces the merged log with that test’s own output. ANSI colour a tool wrote is rendered rather than printed as escape sequences.
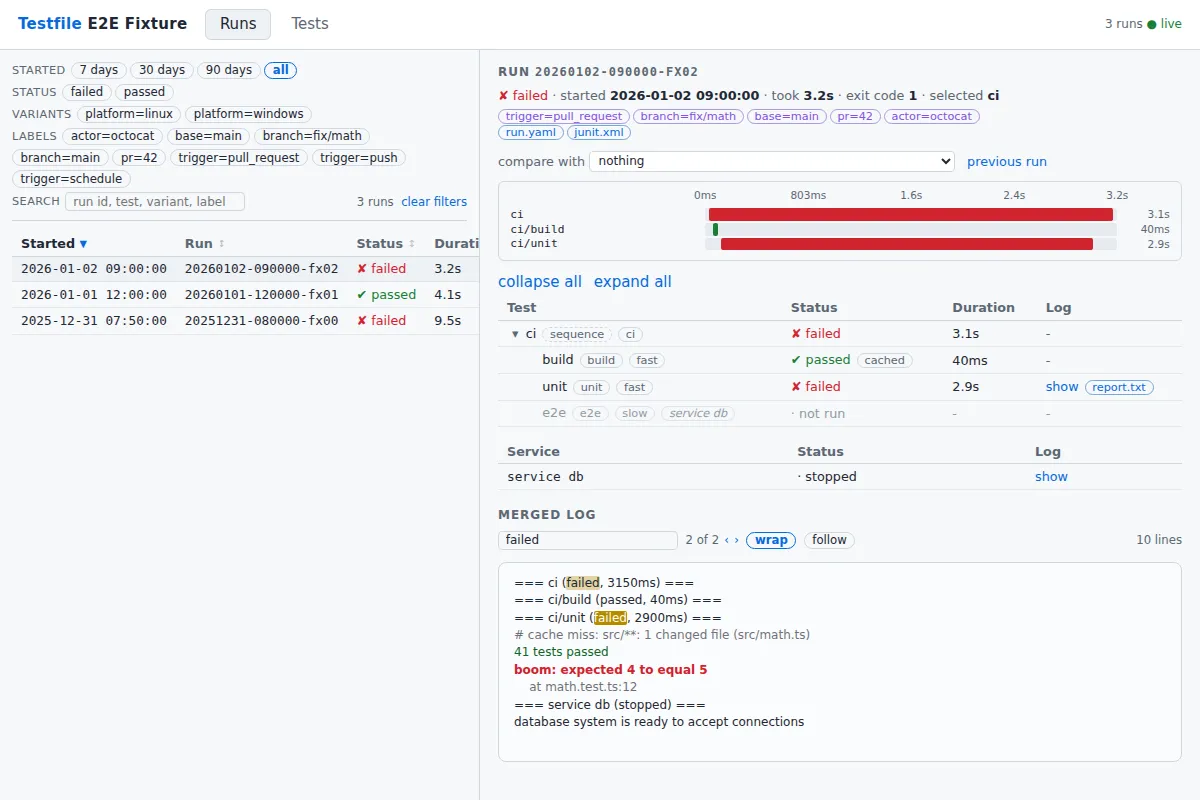
Searching a log
find in log highlights every hit and says which one is current; ‹ ›
walk them and wrap around at the end. Next to it sit a wrap toggle (on
by default) and a follow toggle that pins the view to the end while a
run is still being written.
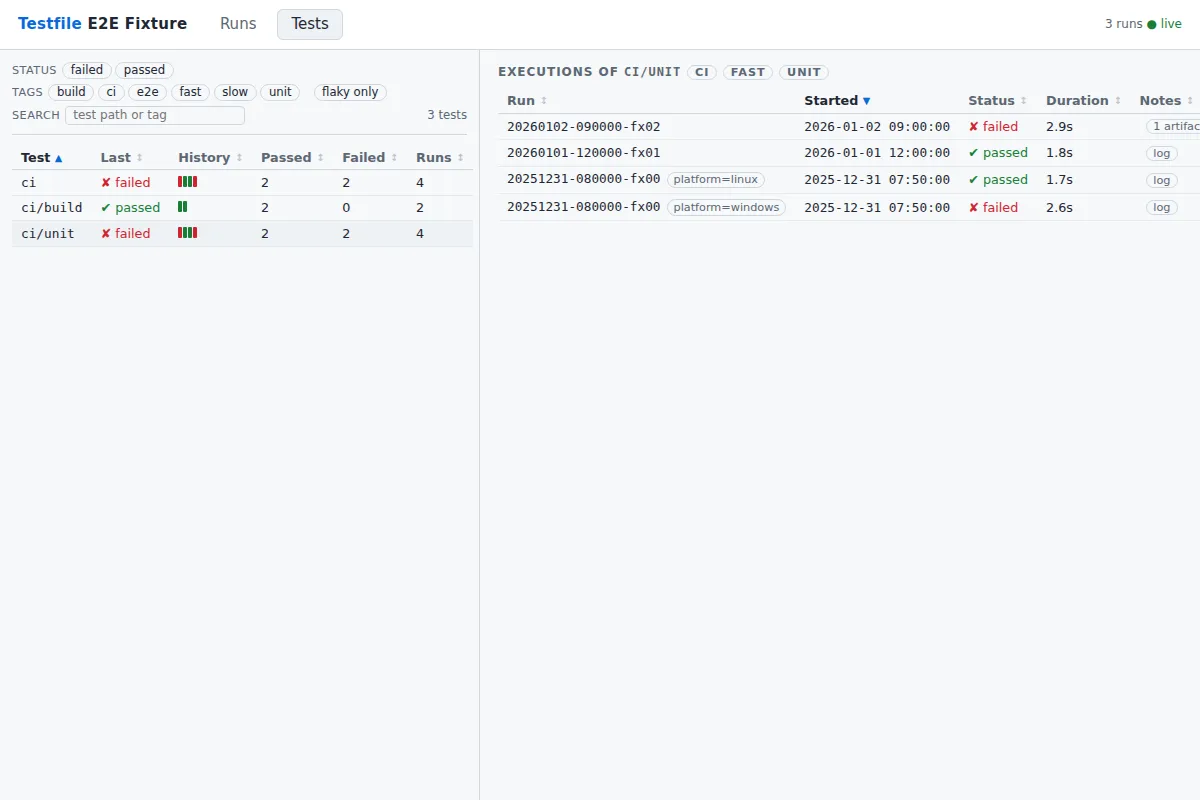
Tests
The other tab looks at the history the other way round: one row per test path with its last status, a sparkline of the recent results and the pass/fail counts across every run. Selecting one lists its executions.
One execution
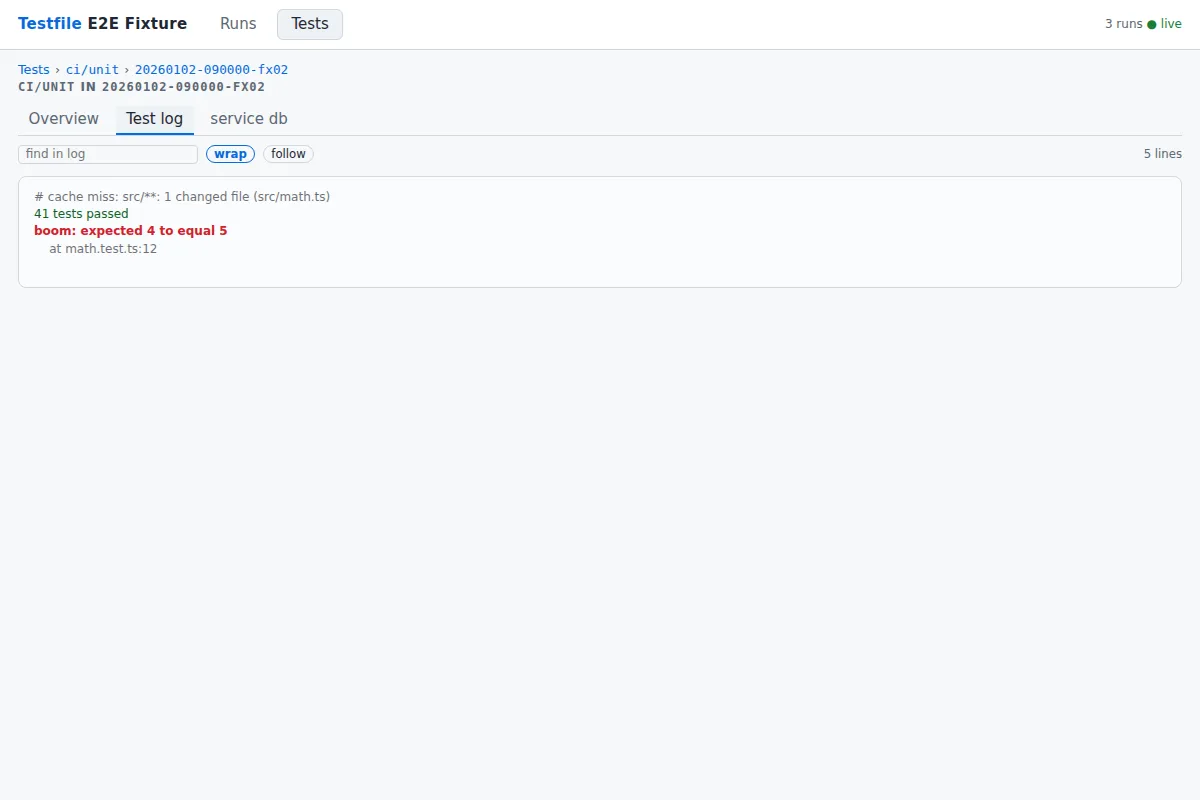
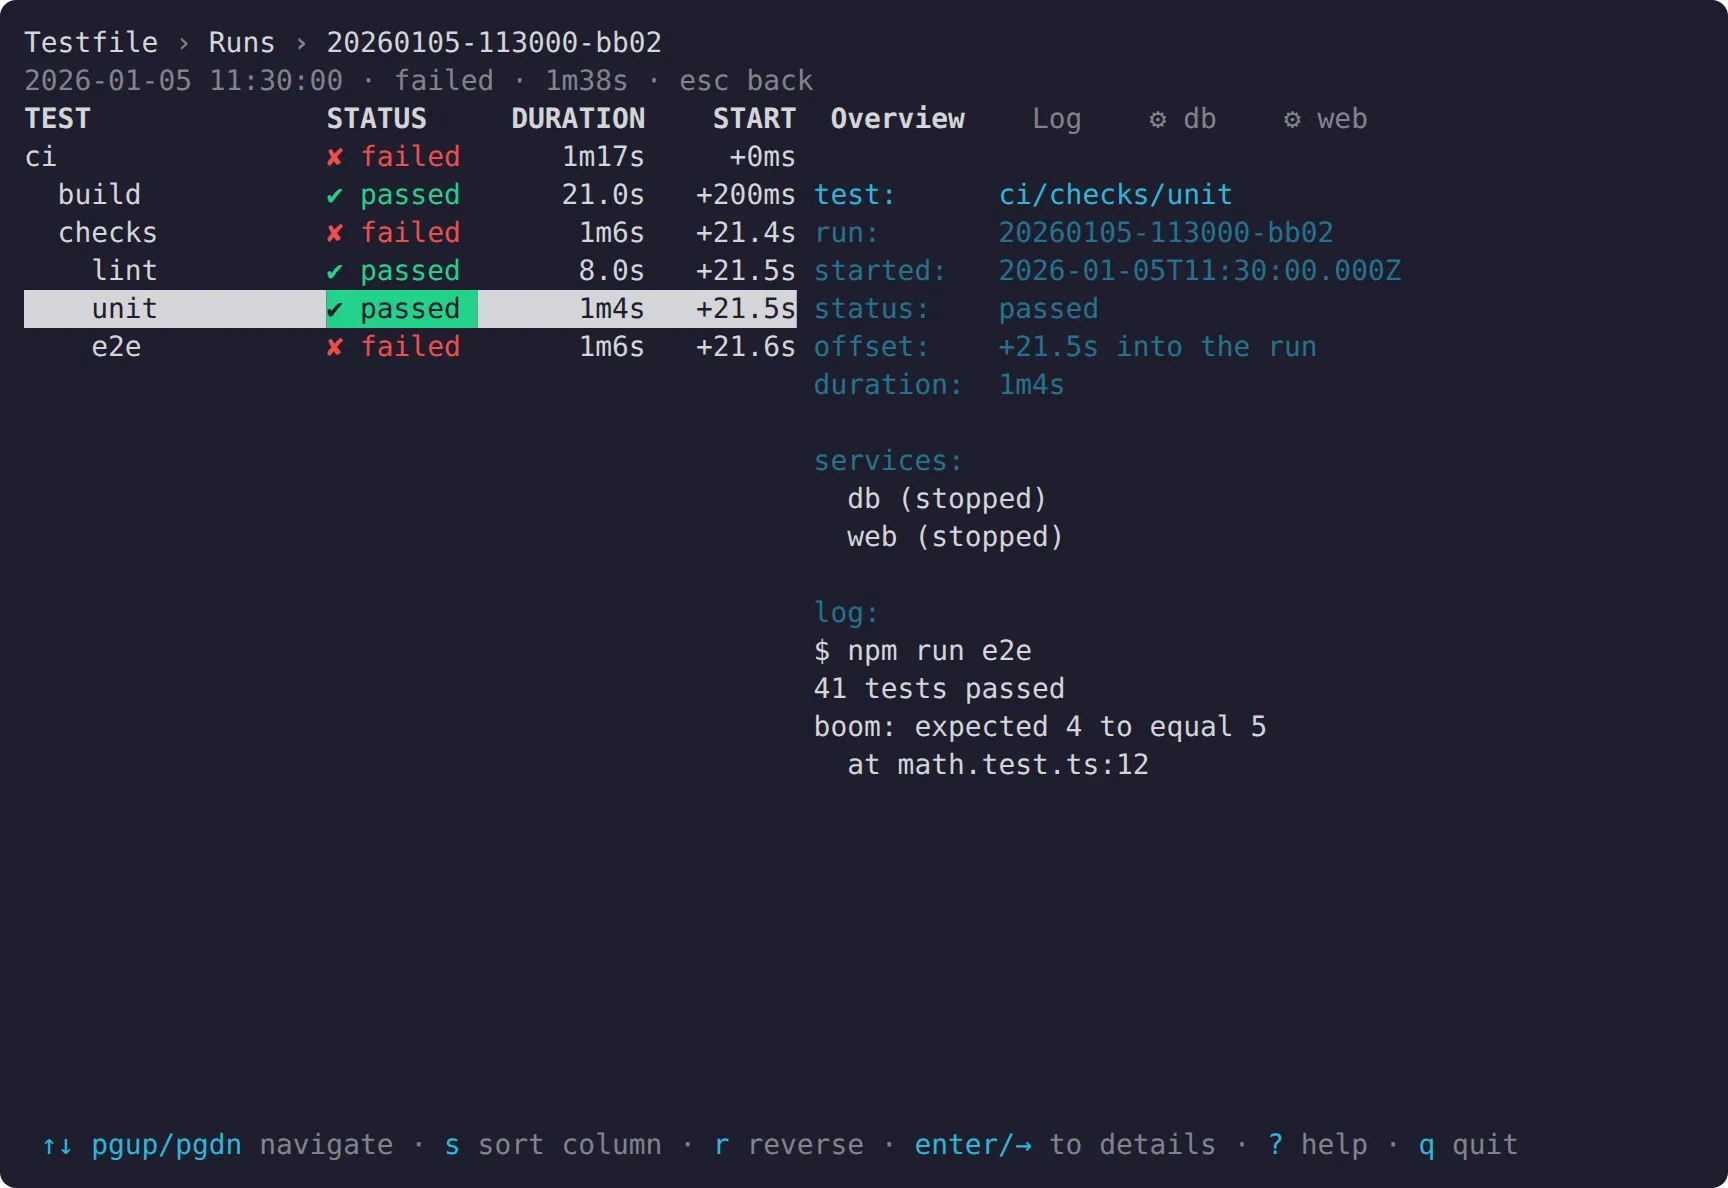
An execution opens its own page — that test in that run — with a breadcrumb back out and tabs across: the overview (its metadata, including why it ran or was served from the cache), the test’s log, and one tab per related service log.
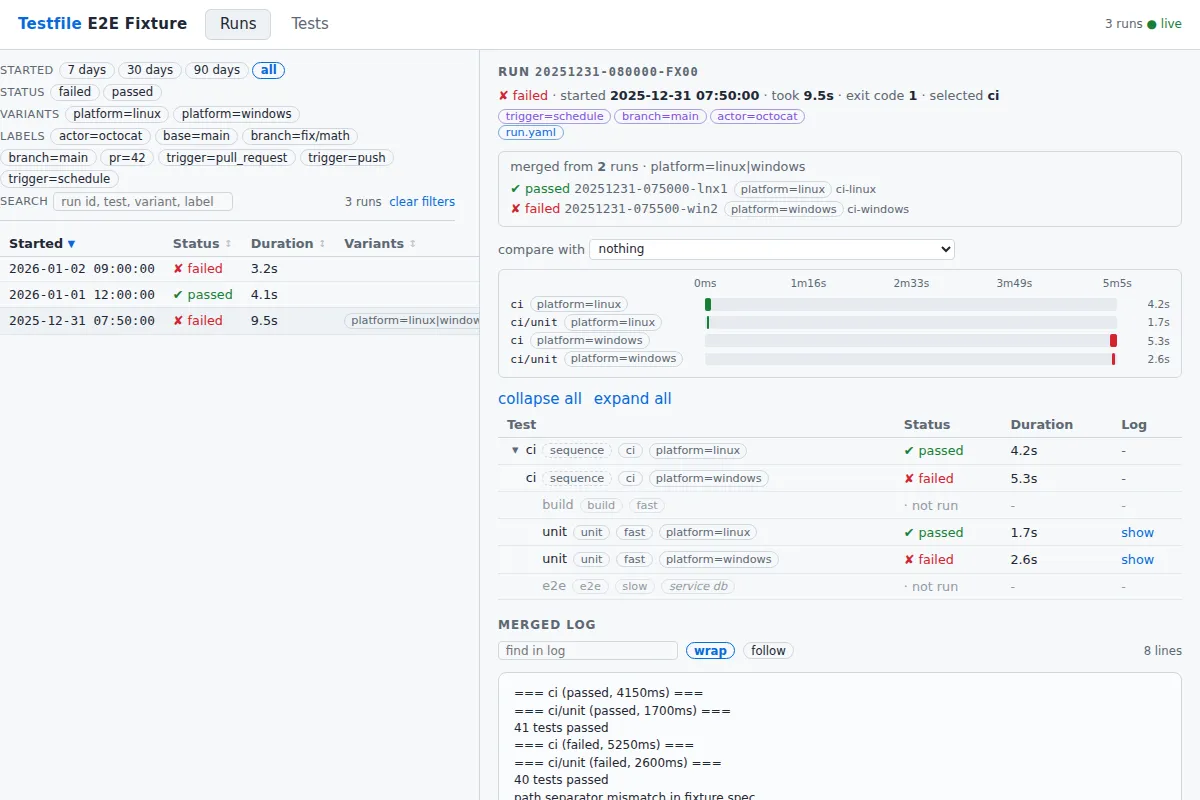
A merged run
Runs merged from several legs say what they were merged from and show the same test once per variant.
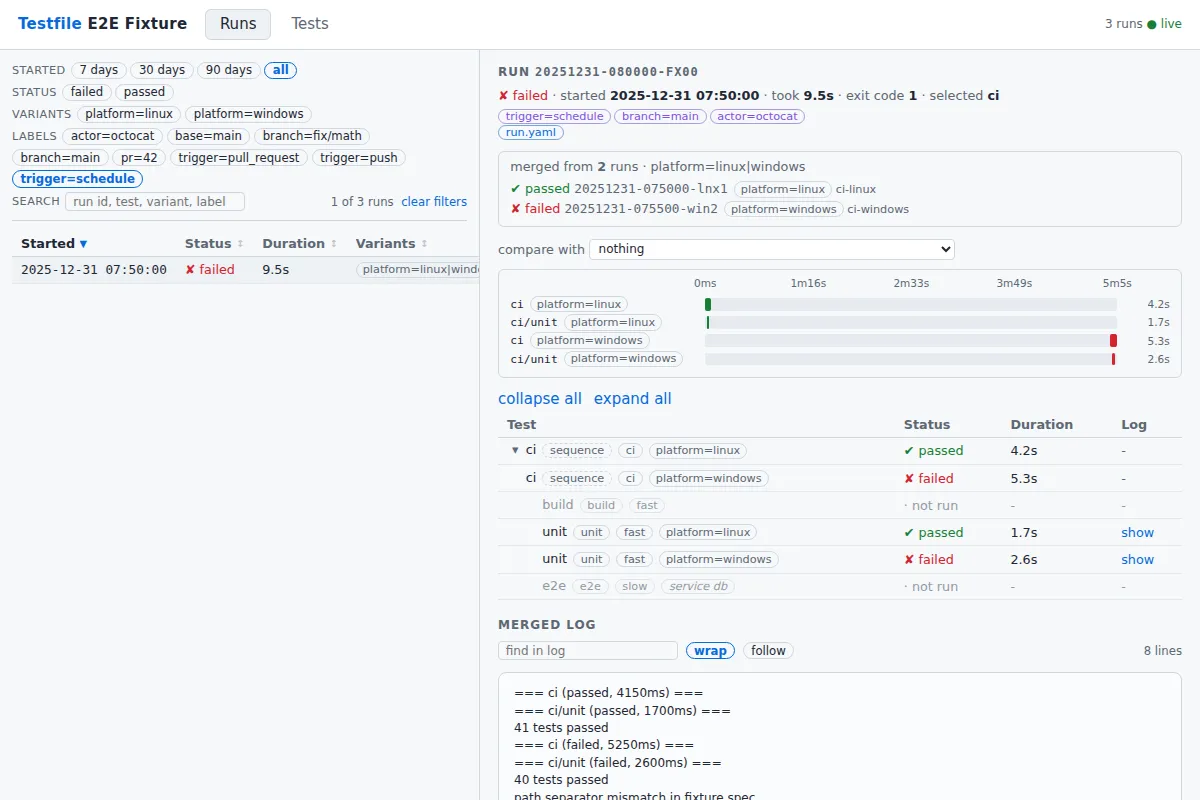
Labels
Every label of every run is a chip in the filter bar, so a branch, a trigger or a pull request narrows the table to its runs — and the text box searches them too.
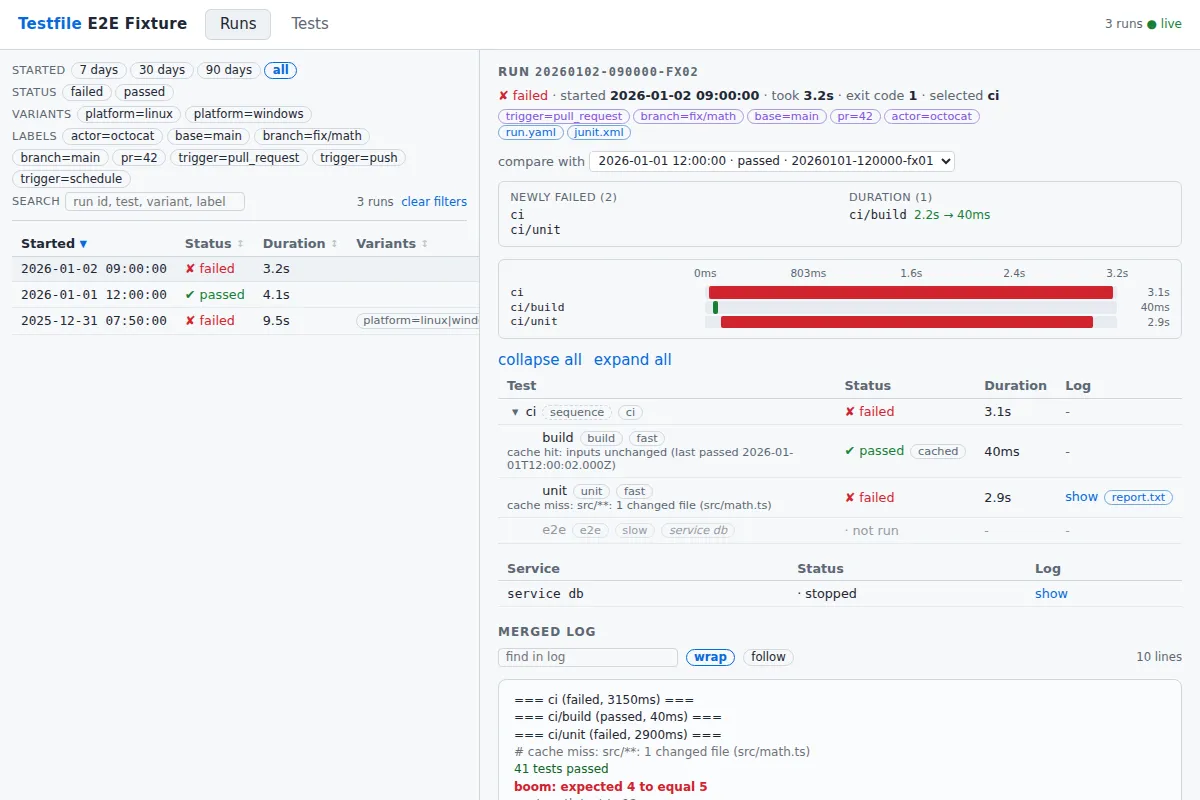
Comparing two runs
A run can be compared with the one before it, or with any other from the
list: what newly failed, and where a duration moved — 2.2s → 40ms for a
test that came out of the cache this time.
Sorting
Every column of every table sorts, both ways, and each table keeps its own sort.
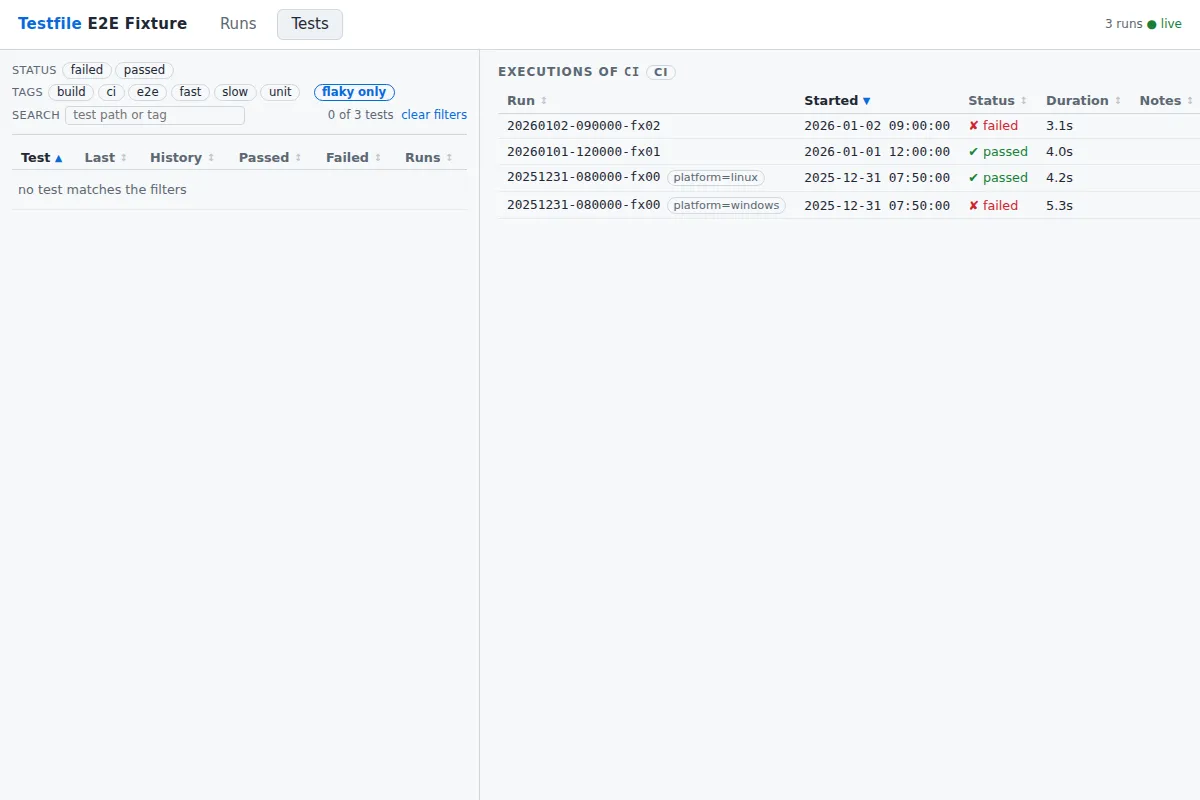
Flaky and broken
Tests that pass and fail on the same input get a verdict — but only once
there are enough results for it to mean anything, which this three-run
fixture does not have, so its flaky only filter comes back empty.
The terminal UI
testfile tui (see the TUI). The status line at the
bottom always lists the shortcuts of whatever is focused.
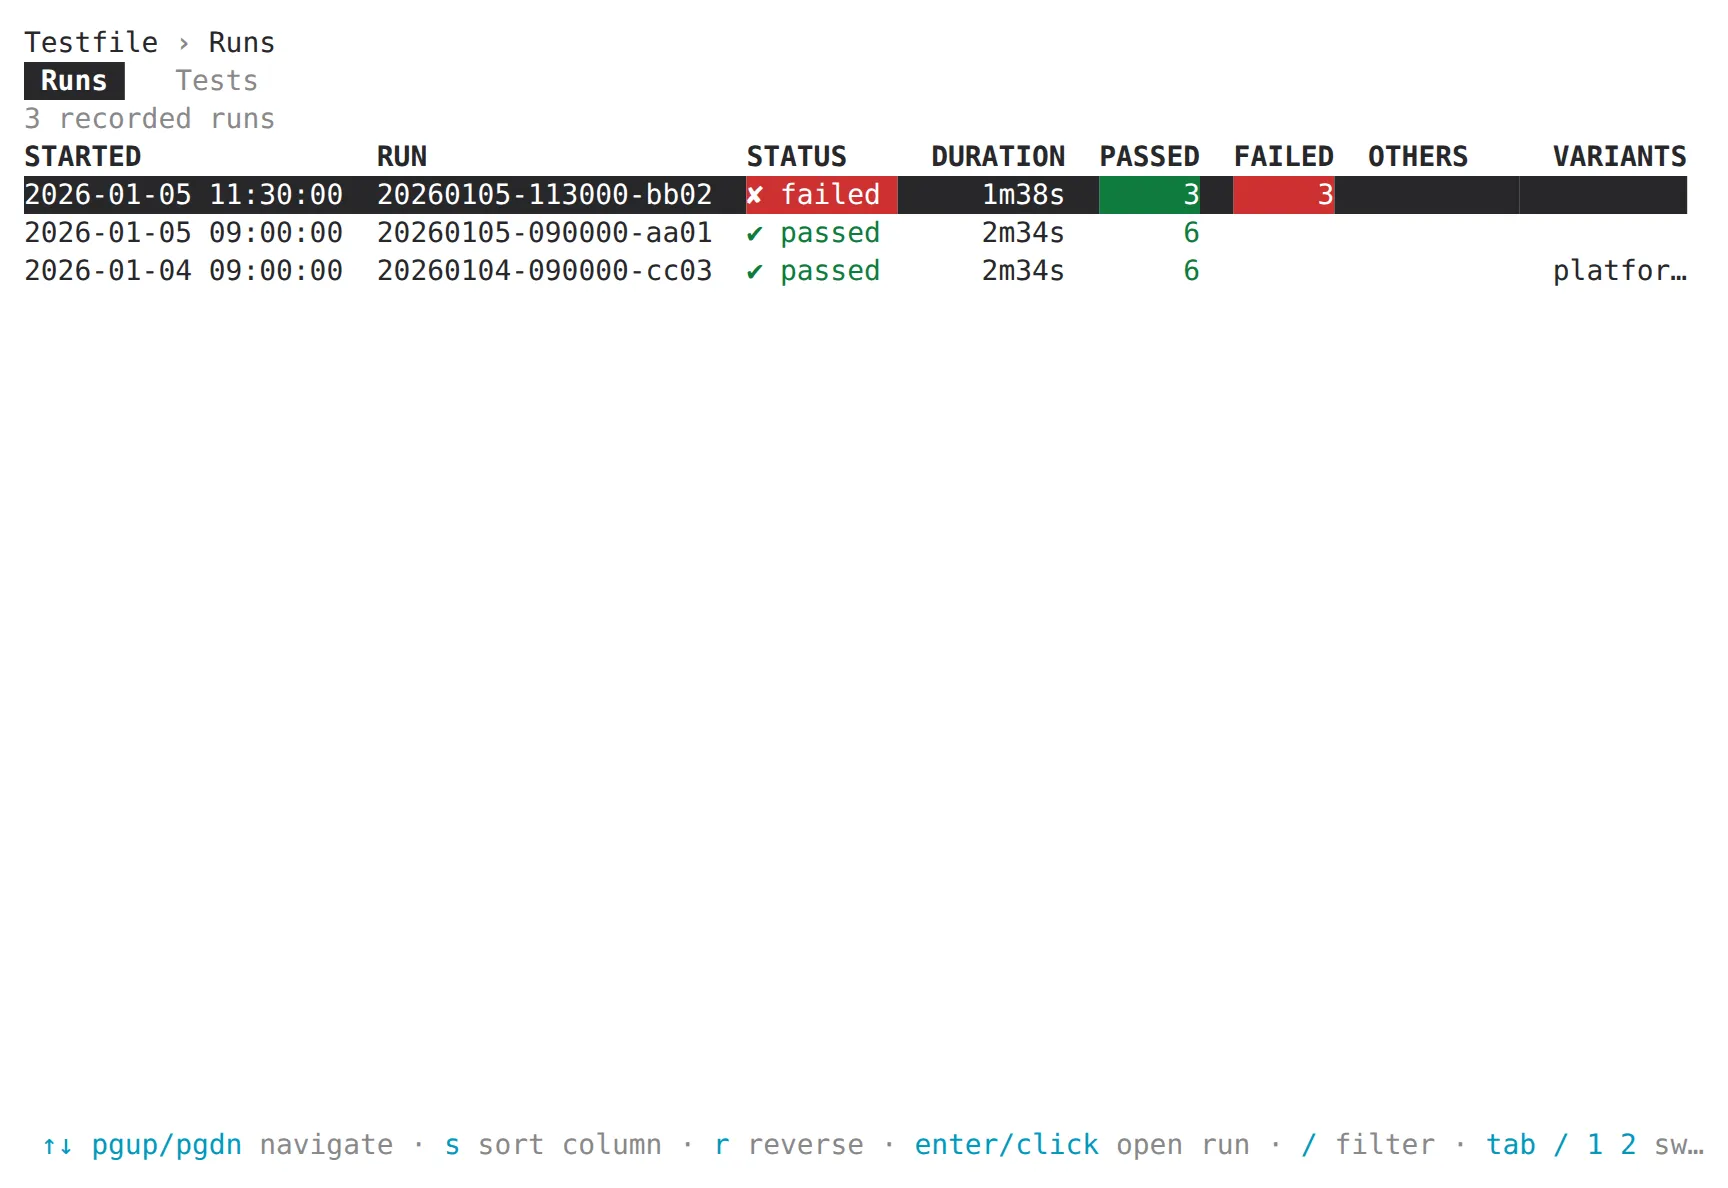
Runs
The index page’s first tab: every recorded run, full width, sorted with
s/r and filtered with /. Enter (or a click) opens the run.
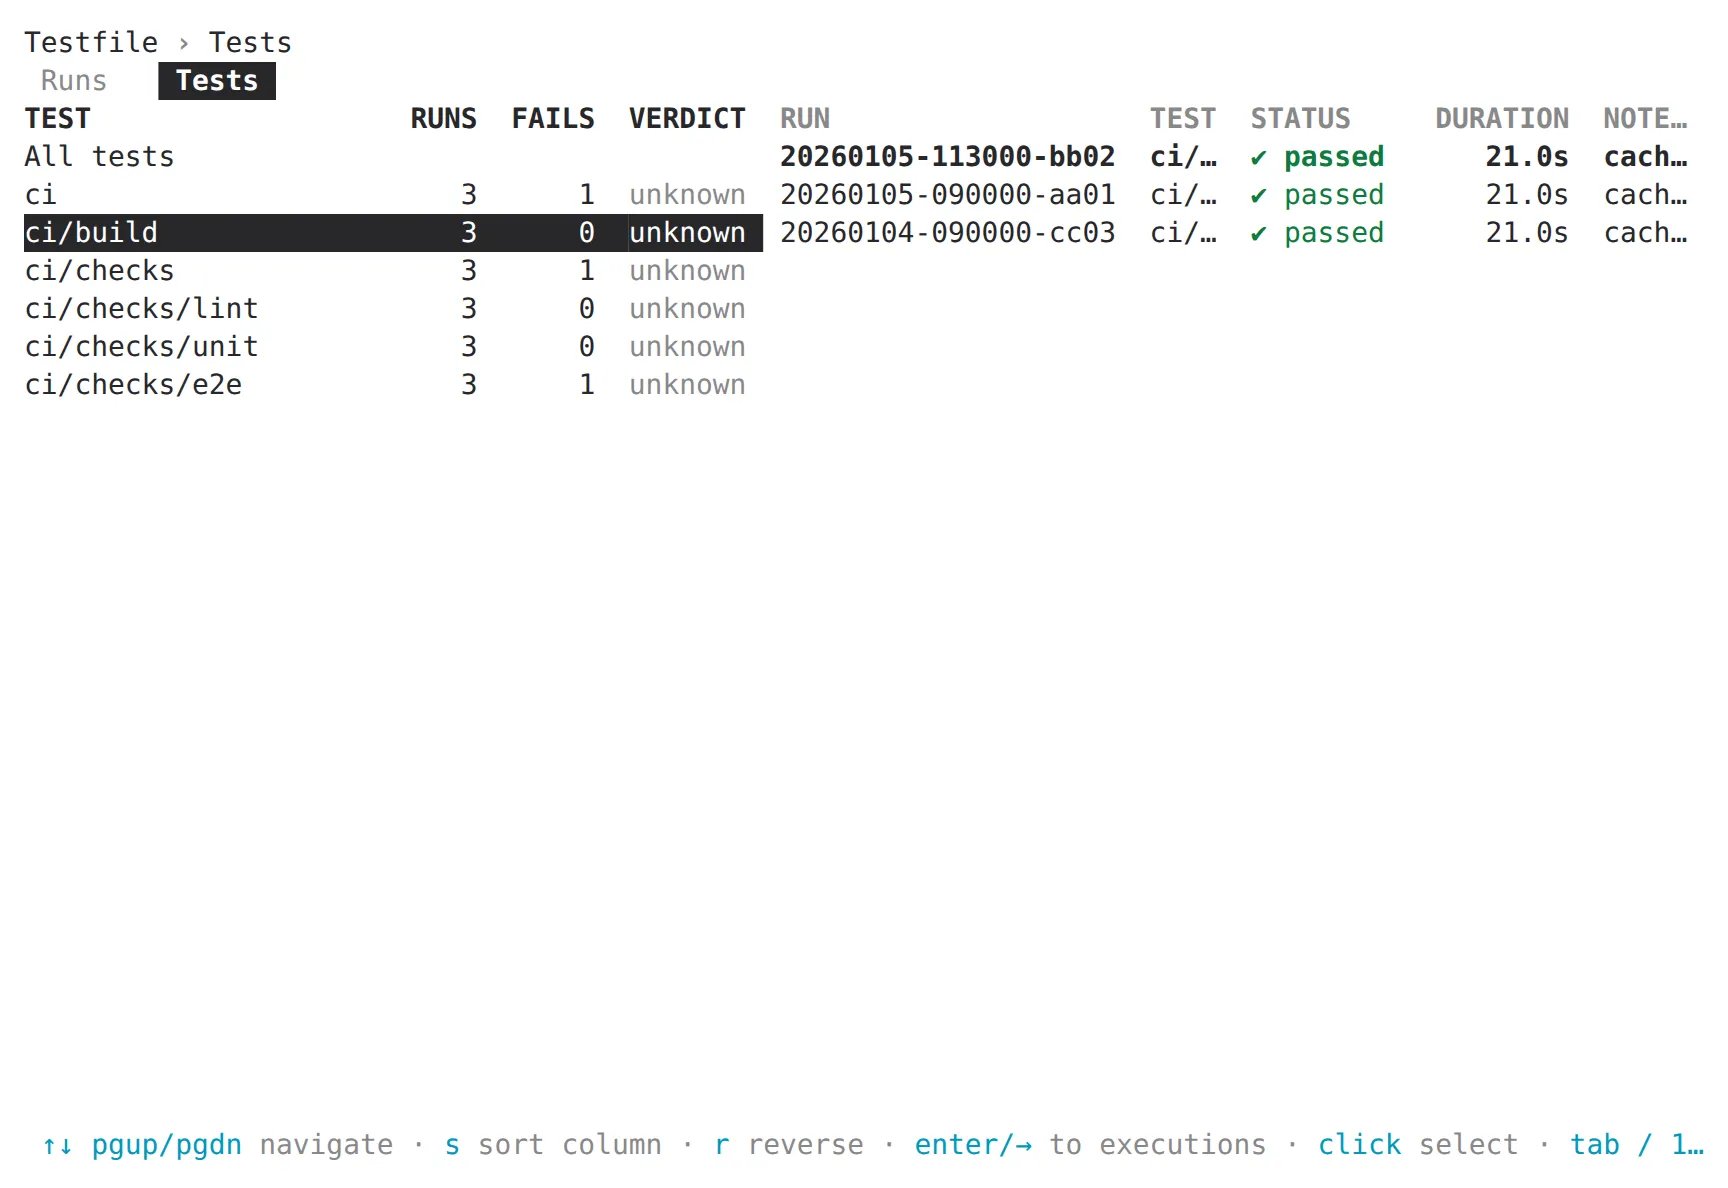
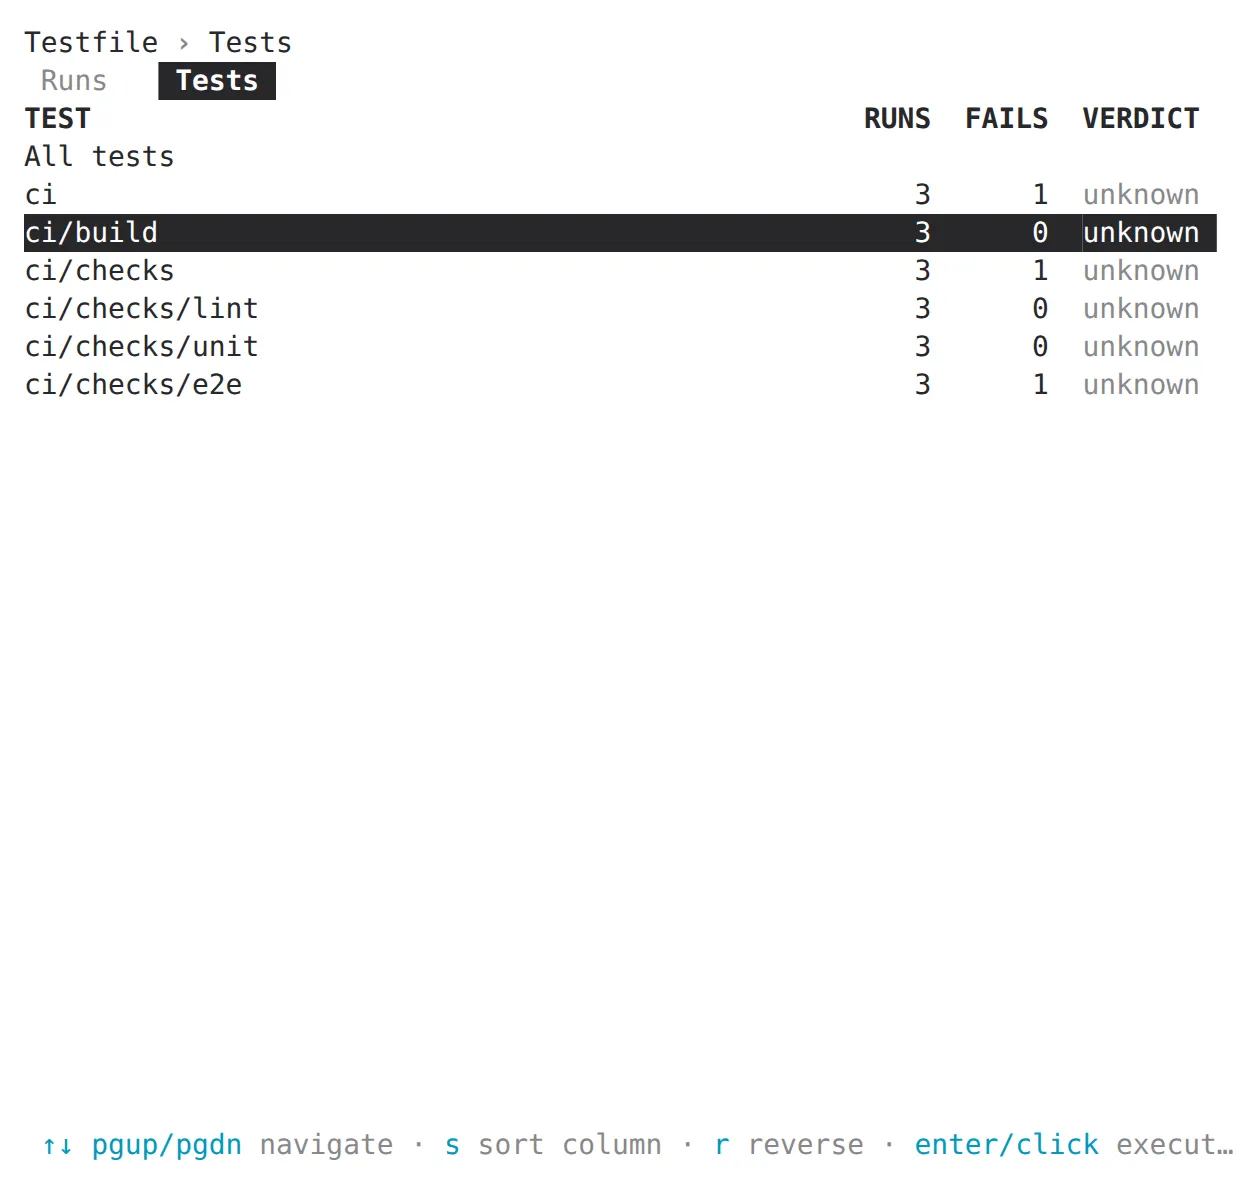
Tests
The second tab, switched with tab (or 1/2): every test path that
ever ran on the left, with its number of runs, its failures and its
verdict — and on the right the matching executions across all runs.
←/→ jump between the two tables.
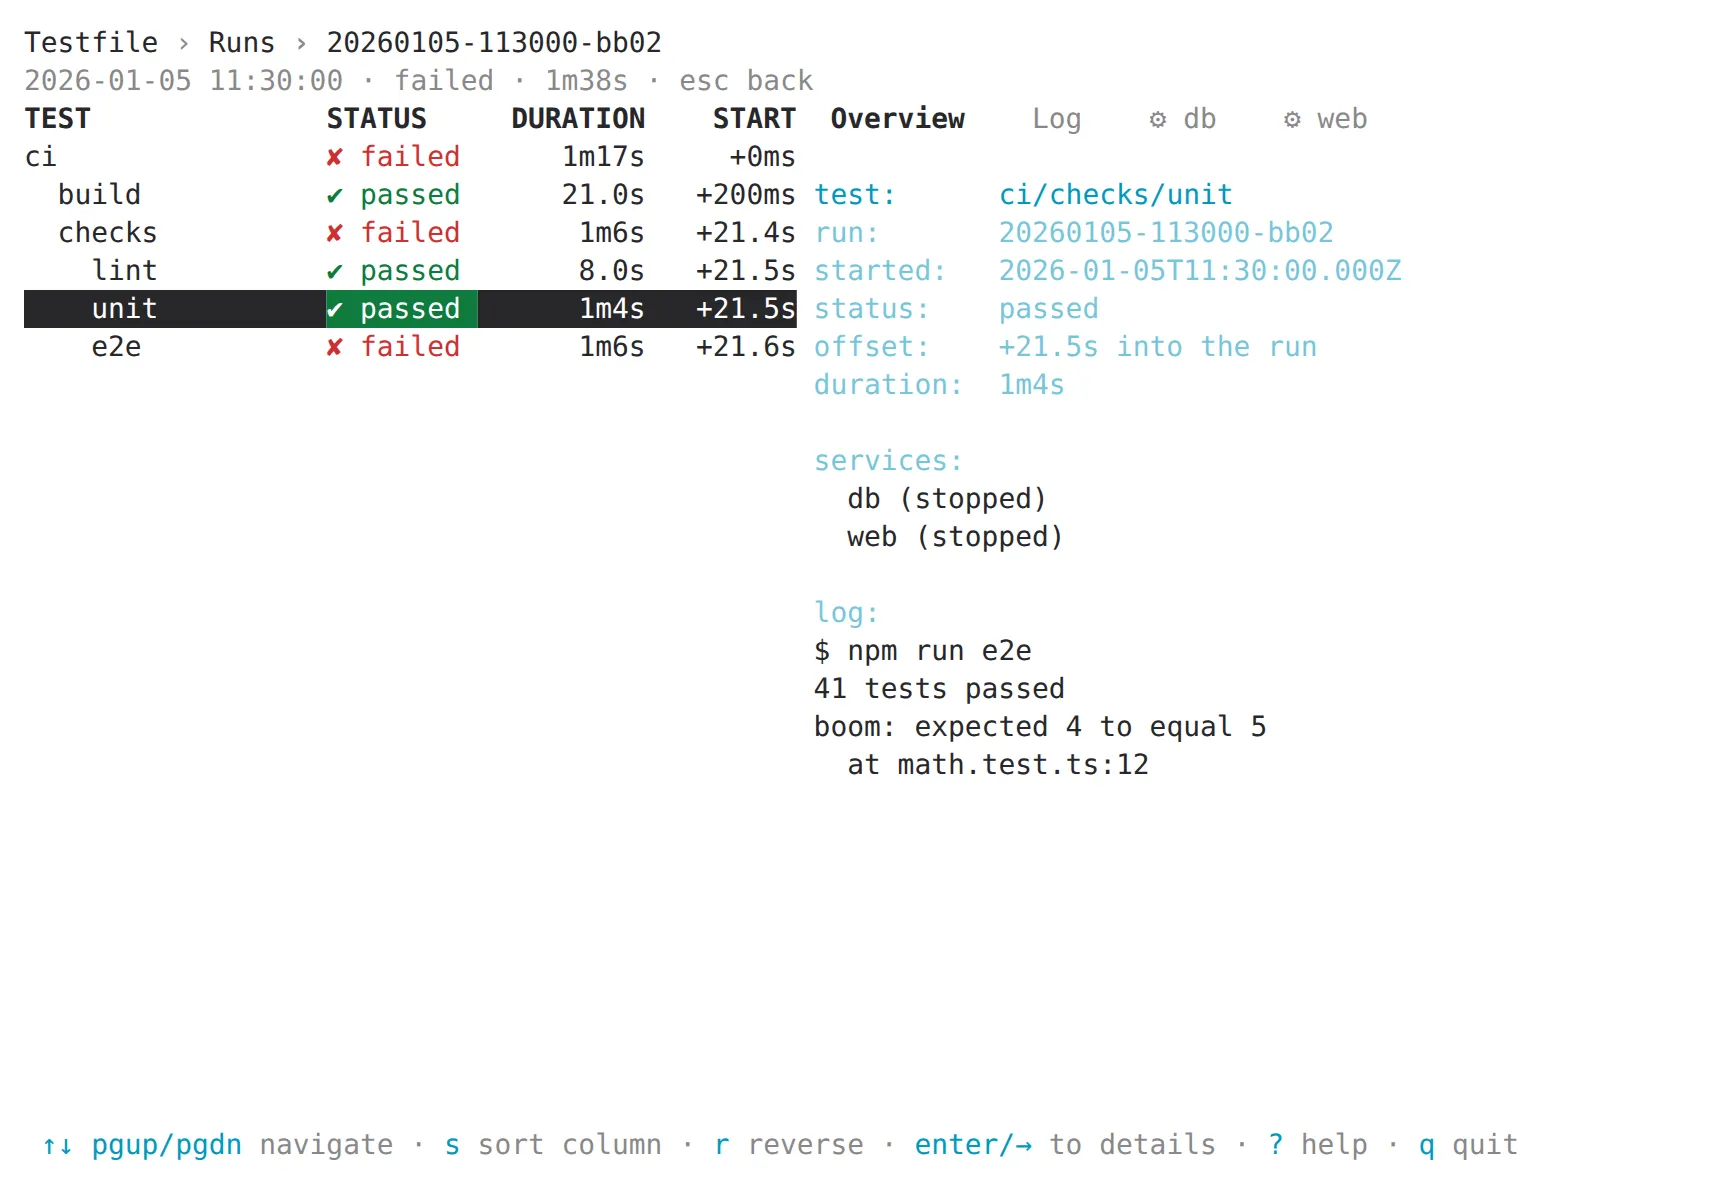
A run
The run page: the suite as a tree table on the left, and for the selected row a tab view on the right — overview, log, and one tab per related service log.
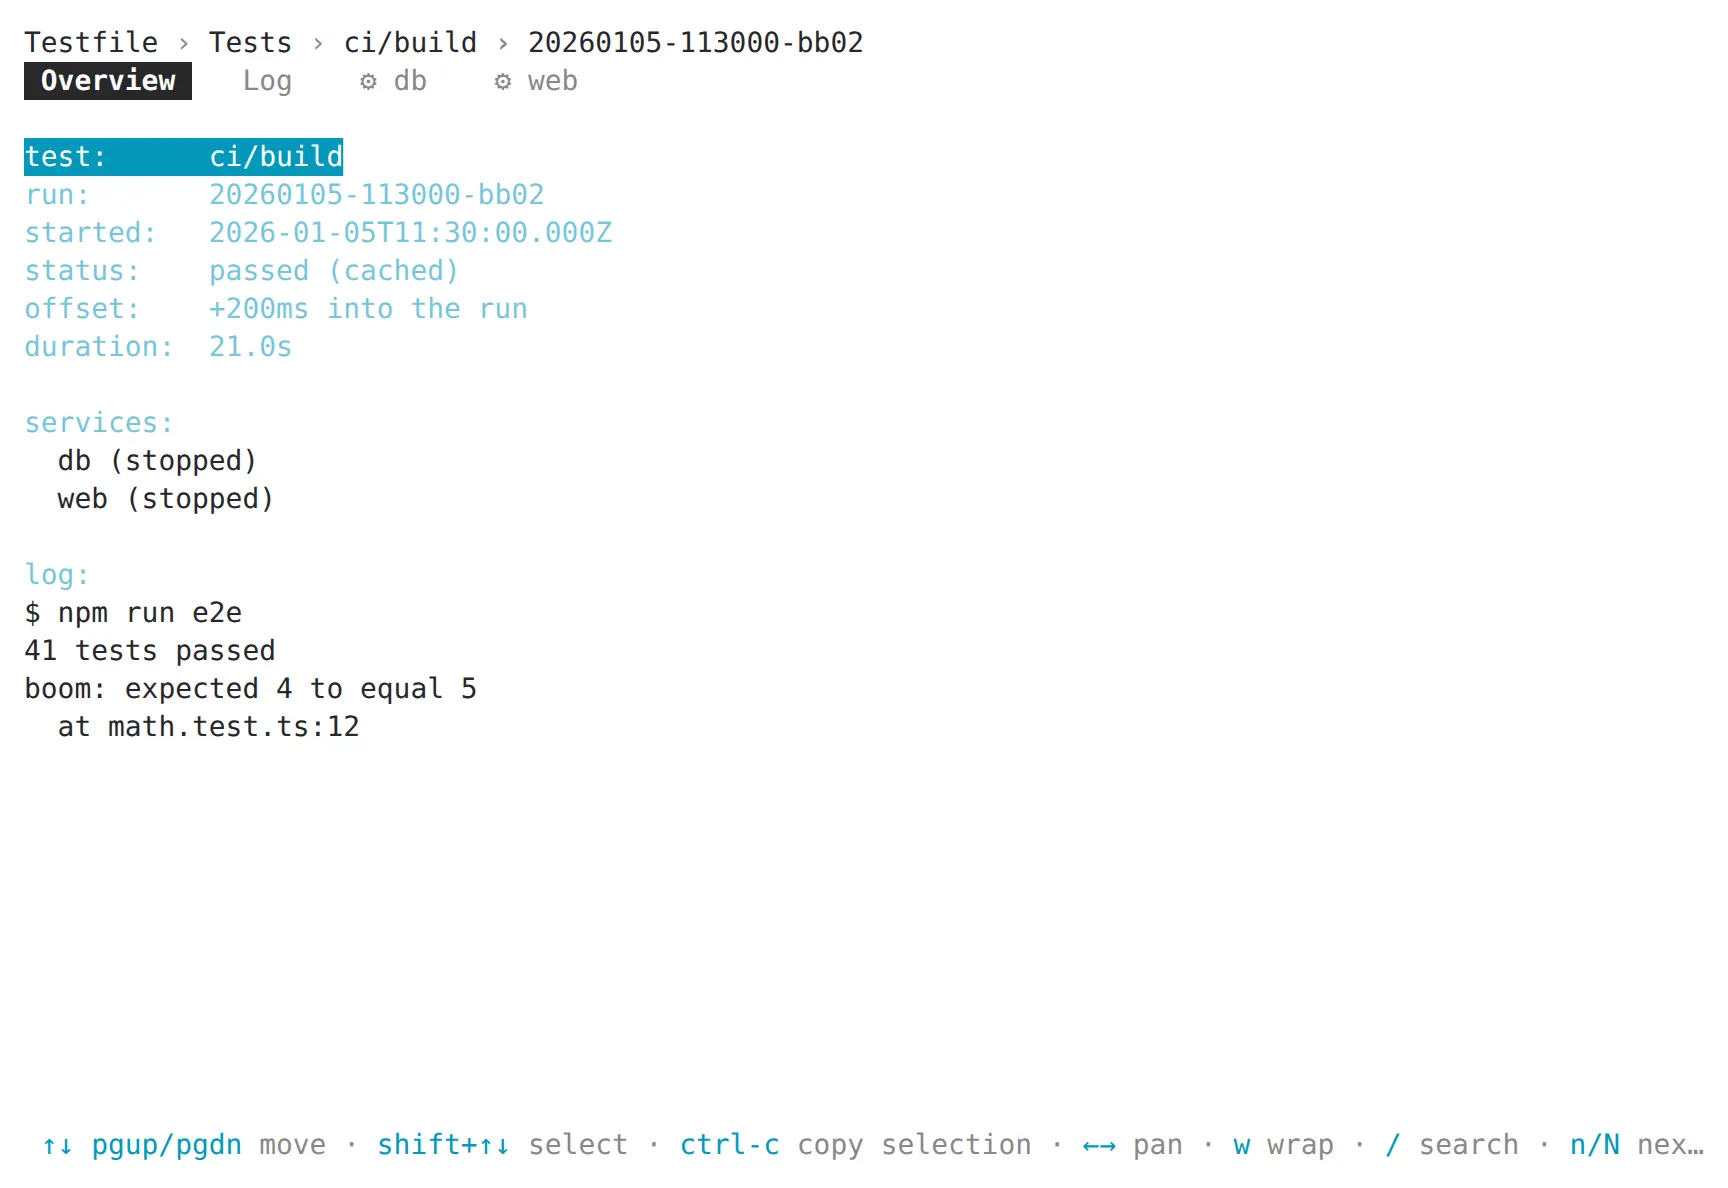
One test
The test page (one test in one run) shows the same tab view full width,
and breadcrumbs its way back — esc lands exactly where you left.
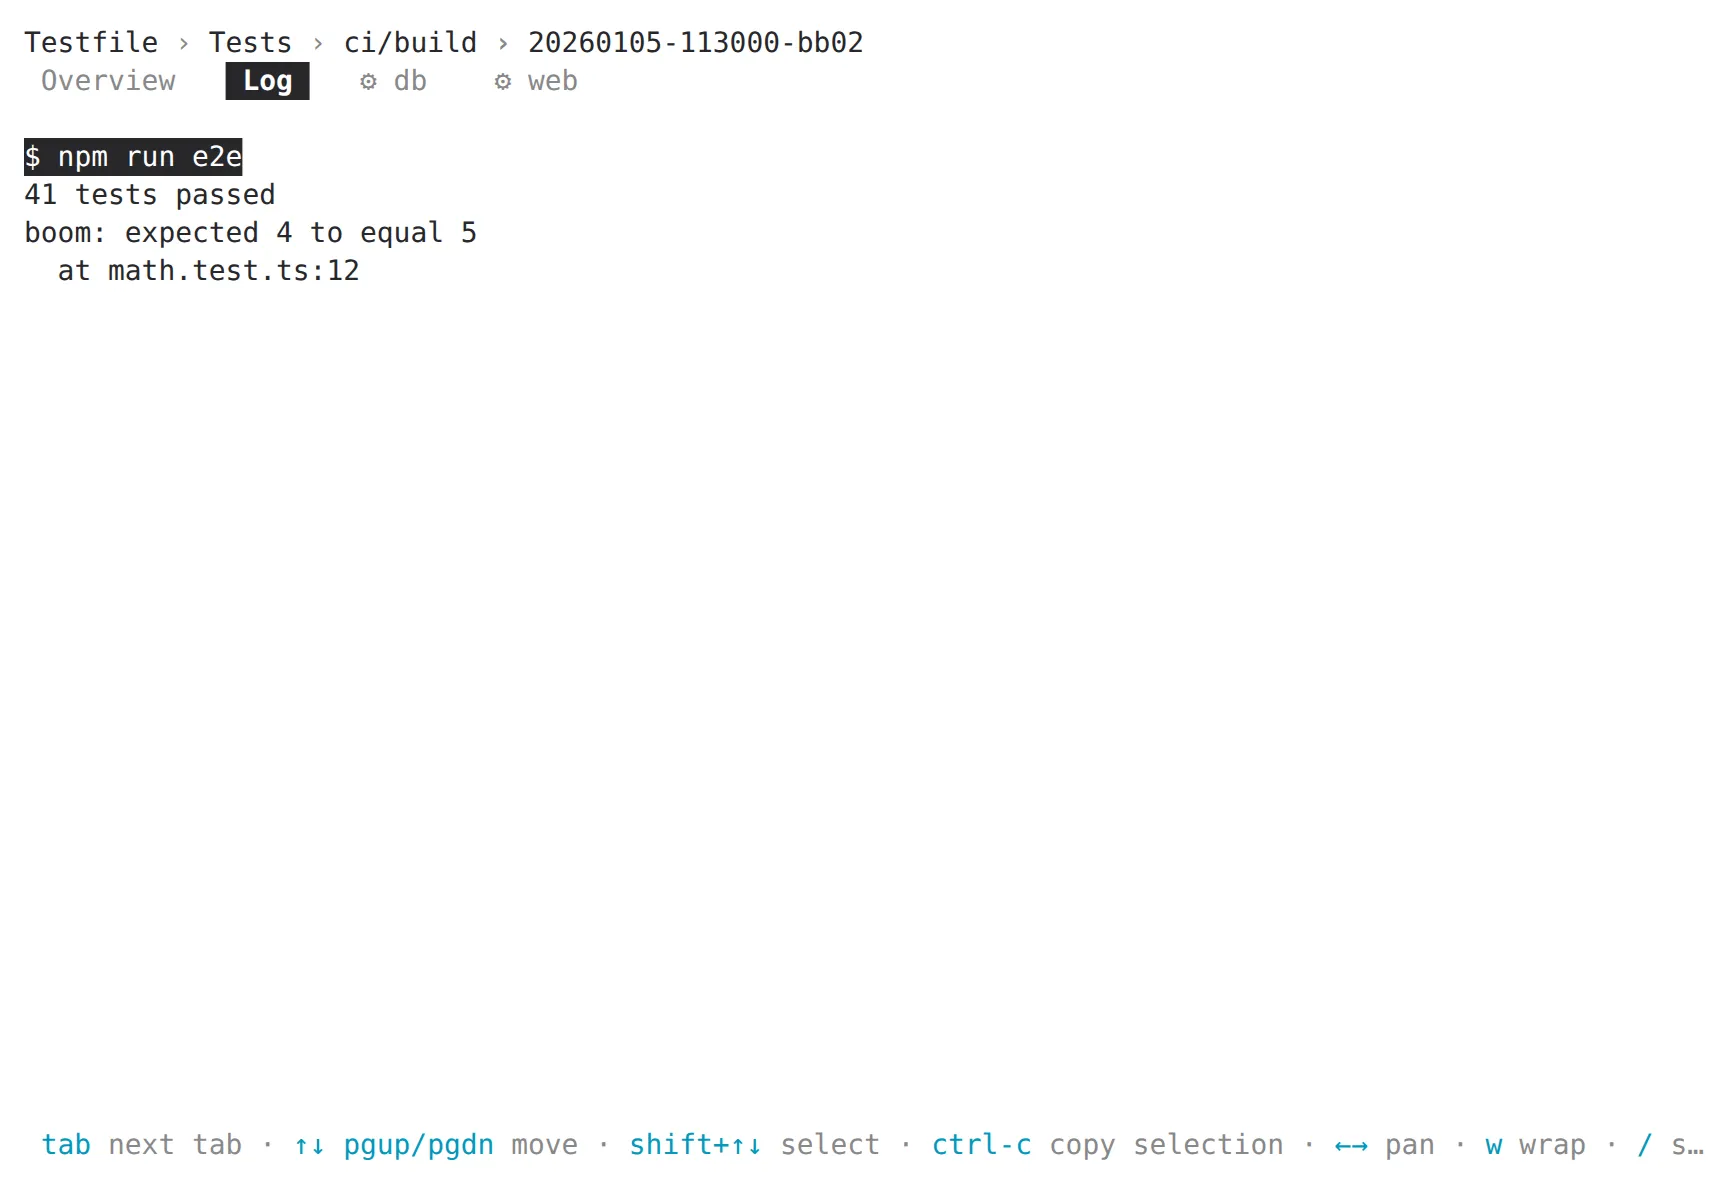
A log
tab cycles to the log. It has a visible cursor line that the view
scrolls with, shift+↑/↓ grow a selection, ctrl-c copies it (OSC 52),
w toggles wrapping and / searches — n/N walk the hits.
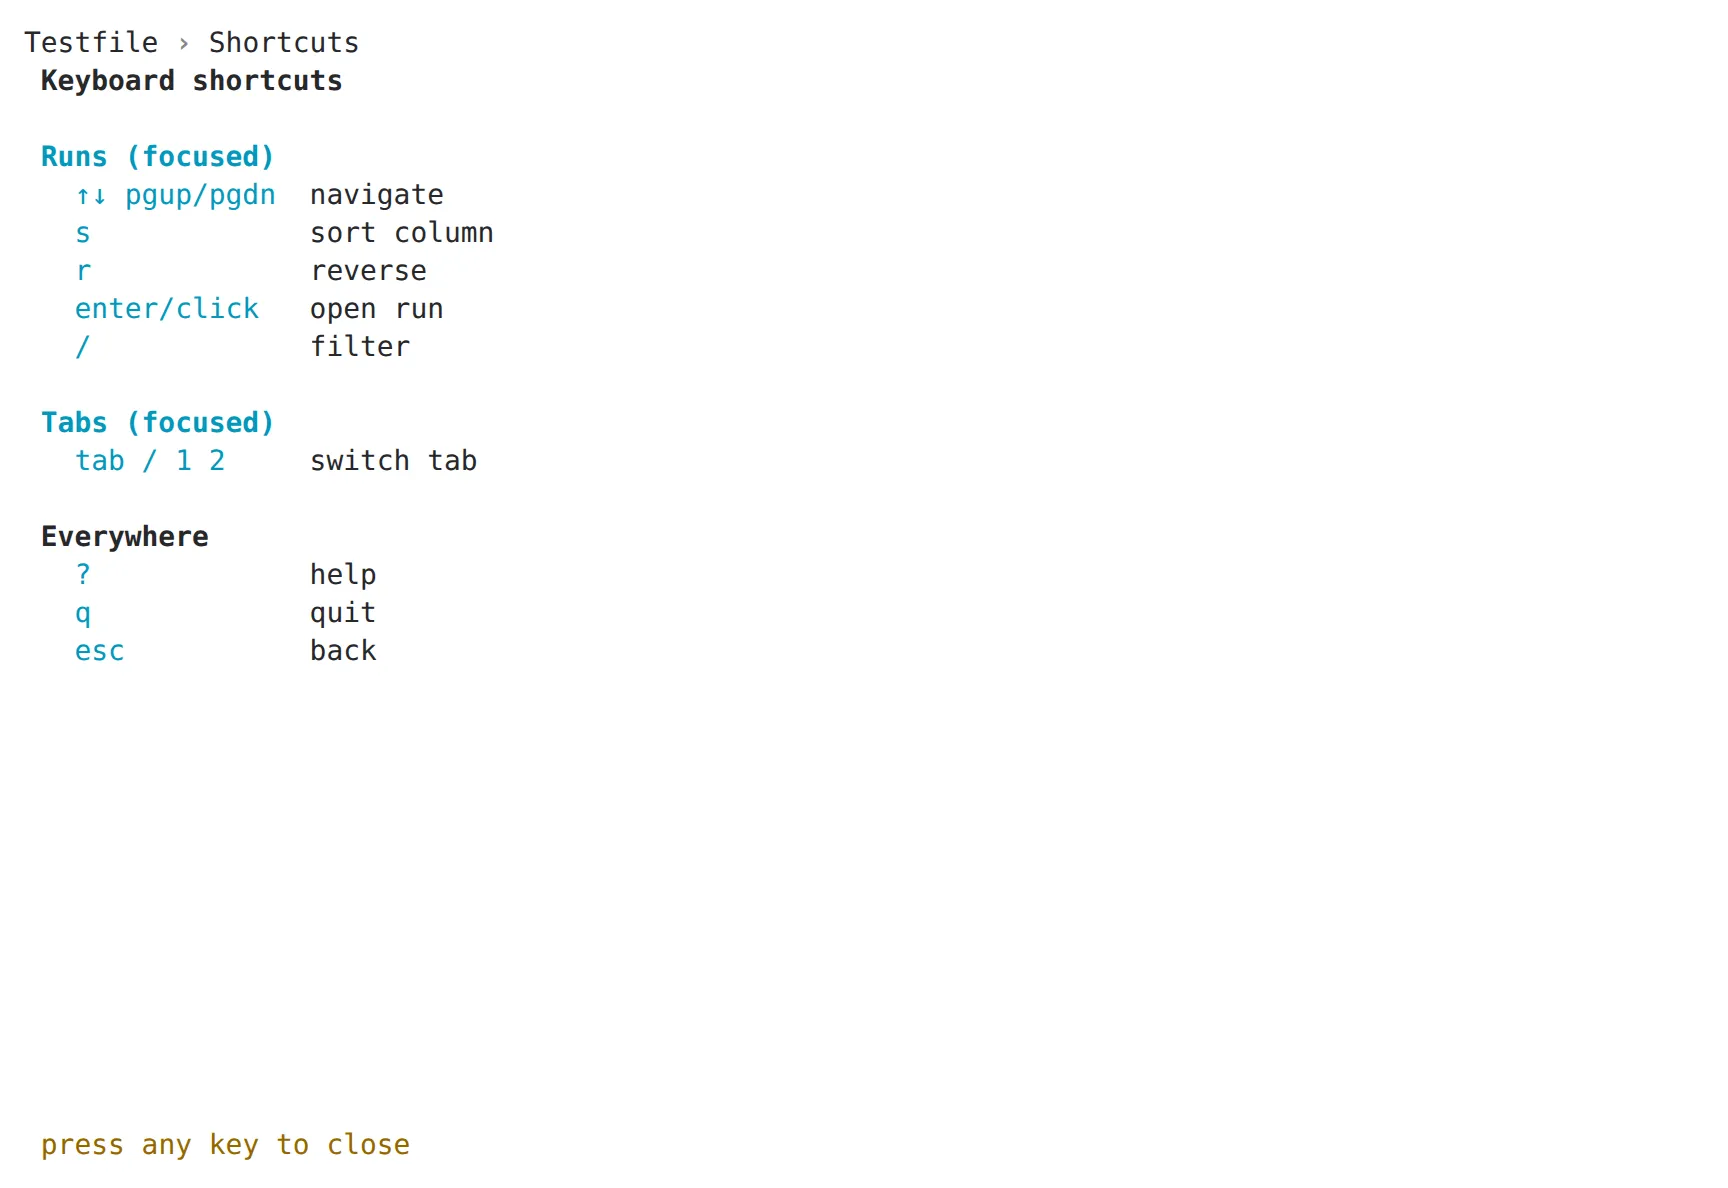
Every shortcut
? opens an overlay with every shortcut of the current page.
Narrow terminals
Below 80 columns the side-by-side tables collapse: only the left panel shows, and details open as their own page.
Dark and light
Both viewers follow their surroundings — the web viewer the system theme (without a preference it stays dark), the TUI the terminal’s palette. The logs follow too: the recorded ANSI colours are mapped onto a palette per theme, so a green test line is readable on either background.
Every screenshot on this page exists in both themes, in
testfile-viewer/e2e/__screenshots__/
and
testfile-ts/tui/screens/
— the latter also keeps the raw frames (.ans) and the SVGs the PNGs are
rendered from.